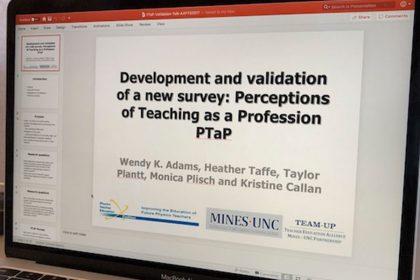
 Perceptions of Teaching as a Profession (PTaP & PTaP.HE) Survey and Analysis Tools
The PTaP and the PTaP.HE are research instruments designed to measure student and faculty perceptions of the teaching profession, respectively.
Audience/Setting: PTaP: Any STEM students and PTaP.HE: Any faculty, staff, or advisor
Time: 8-10 minutes to take the survey
Synopsis: Give the PTaP to assess student perceptions about grade 7-12 math and science teaching as a profession. Give the PTaP.HE to assess college/university faculty, staff and advisors’ perceptions of grade 7-12 math and science teaching as a profession.
Implementation
Each survey takes approximately 10 minutes to complete and can be effectively administered during class time or as part of a faculty meeting. If you would like to see the questions on each survey or administer hard-copy, please download the PDF files under “Materials” below. If you would like to collect larger-scale data from your department, both surveys are available on SurveyMonkey (PTaP, PTaP.HE); however, please contact us before distributing links and collecting data. More detail about the development and validation can be found in the PDF slide decks linked below.
Make sure to register as a GFO Champion and to log your GFO related activities!
PTaP
Materials
Empirical Survey Categories
Through our development work and statistical analysis, we determined 11 empirical categories of students’ perceptions of teaching as a profession:
- Personal Enjoyment
- Employee Benefits and Stability
- Teaching is Scientific
- As a Career Choice
- Others Support Me Teaching
- My Department Supports Me Teaching
- My Department Values and Encourages Teaching
- Nurturer
- Back Up Plan
- All Students Can Learn
- I Would If…
Data from the 11 empirical PTaP categories has a range of uses including identifying the number of students who would pursue teaching given correct information about the profession. The PTaP can also be used longitudinally or pre/post to monitor your efforts to get the facts out about the profession.
If you would like our research team to analyze your data and send you yearly reports specific to your institution, you can sign up to be an official survey data collection site for the Get the Facts Out project. By doing so, you would collect PTaP/PTaP.HE data each year and in return, we would analyze your data send you reports about the perceptions of teaching at your institution.
If you are interested, please contact GFO Central at GettheFactsOut@mines.edu.
PTaP.HE
Materials
Empirical Survey Categories
Through our development work and statistical analysis, we determined 8 empirical categories of faculty members’ perceptions of teaching as a profession:
- Benefits of Teaching
- Facts about Teaching
- Teacher Work Environment
- Supportive Department Messaging
- Teaching is an Attractive STEM Career
- Teaching is a STEM Profession
- Career Options
- All Students Can Learn
Data from the 8 empirical PTaP.HE categories is useful for measuring support for and knowledge of the teaching profession among your faculty members. Additionally, it can provide you with targets for improving perceptions, which can have a lasting impact on teacher recruitment at your university.
Again, if you would like our research team to analyze your data and send you yearly reports specific to your institution, you can sign up to be an official survey data collection site for the Get the Facts Out project. By doing so, you would collect PTaP/PTaP.HE data each year and in return, we would analyze your data send you reports about the perceptions of teaching at your institution.
If you are interested, please contact GFO Central at GettheFactsOut@mines.edu.
Good to know
- These resources were developed with data from STEM undergraduates, graduates, and faculty at a range of U.S. universities.


