Teacher State Specific Benefits
Here we provide some information on state specific financial benefits for teachers, whether that’s towards your education, or a retirement plan. The map below holds a series of PowerPoint slides dedicated to each state which dives deep into Scholarships and Loan Forgiveness opportunities for those who are planning to earn their teacher certification, or even teachers looking to go back for further education. In each PowerPoint, there is also a breakdown on that state’s Retirement Plan which shows not only the pension a teacher will receive, but also gives comparable savings required if a person wanted to match a teacher’s pension in a different profession. All the numbers and equations to calculate your own pension based on your own unique situation are also included.
Click here for a list of state scholarships, grants and loan forgiveness programs for all states. It also includes information about federal programs.
How to Read a Retirement Slide
Each retirement slide is packed with information which can sometimes be overwhelming. The following is a guide to help you understand what each slide represents.
Slide Itself
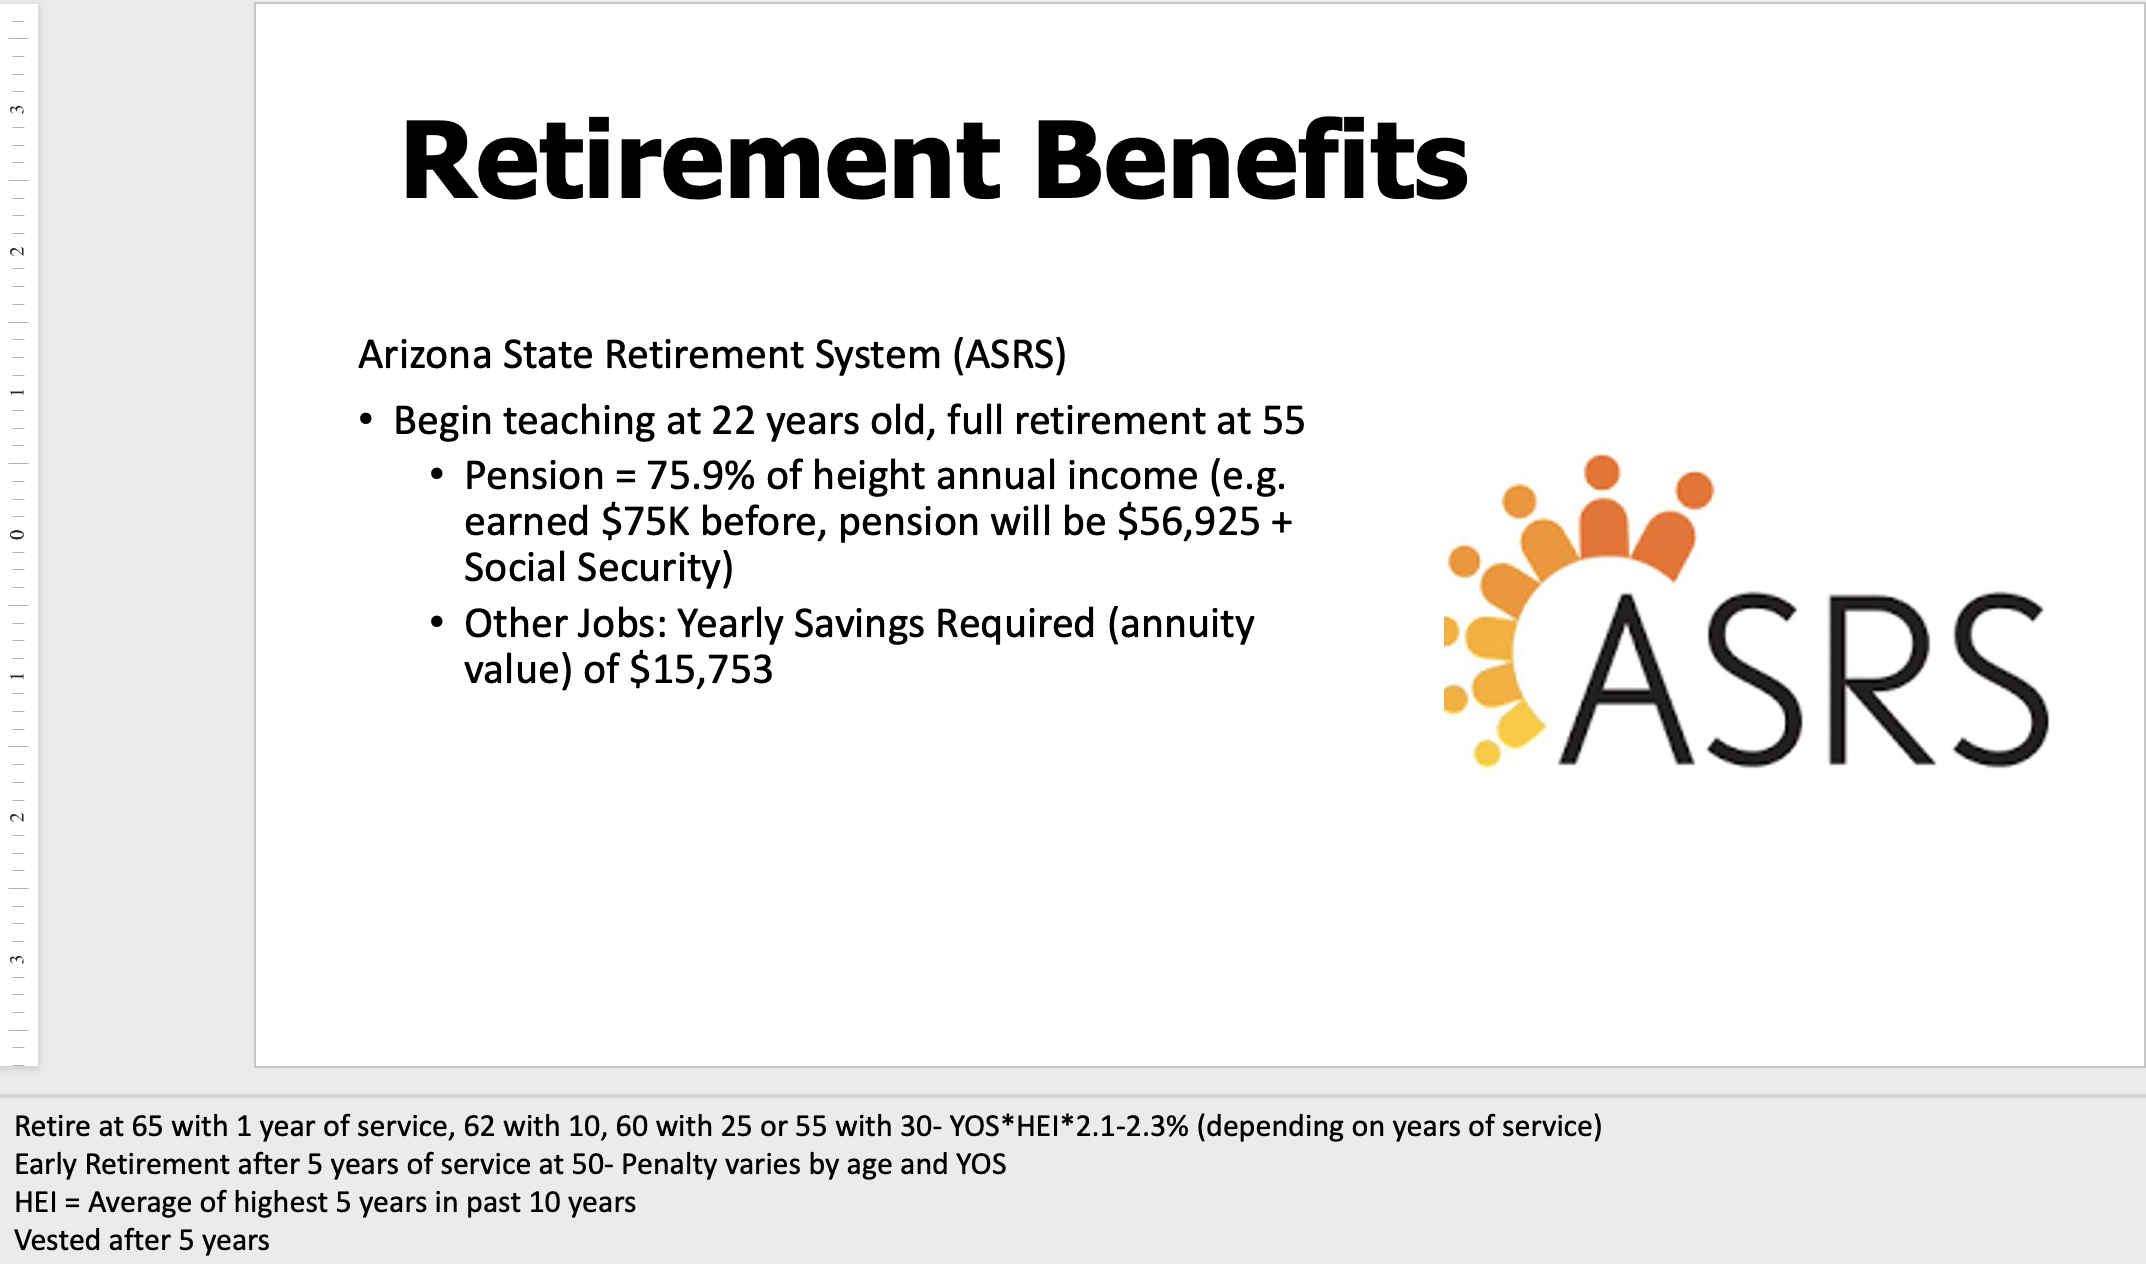
On the retirement slide itself, you’ll see a list of information along with a picture of the logo from the retirement organization. In the slide text you’ll first see the name of the retirement plan. From there, you’ll see a few stats about potential salary. For most states, we estimated a starting age of 22 years old and then show the age of retirement which reflects the earliest a person is eligible for full retirement benefits. The notes section of the slide outlines the state rules for determining these facts.
The first sub-bullet indicates a person’s pension if they retired while earning the noted salary (HEI – Highest Earned Income). In the Arizona example above, it is showing that for a person who was earning $75,000 before retirement, their pension will be 75.9% of that salary which is $56,925. In Arizona, a teacher will also receive Social Security. There are 15 states where teachers do not have SS in addition to a pension for the years worked as a teacher – in those cases the slide will not say “+Social Security”.
The second sub-bullet shows how much money a person in a job other than teaching, would have to save to match the pension of a teacher. In the Arizona case, a person would have to save $15,753 per year, every year from age 22 to age 55, if they want to have a pension of $56,925 every year until they are 85 years old. But if they live longer then that, they will have had to save more than the $15,753. This calculation assumes inflation of 3% and a Rate of Return on your investment of 7%.
Notes Section of the Slide
The notes section of each slide includes the specific data for determining that state’s retirement benefits. Each slide follows relatively the same format as the above example. The first bullet is the teacher contribution, how much is deducted from each paycheck for their contribution to the program.
Next is the detail on how to calculate when someone is eligible for full retirement as well as how much the pension will be. Some states have multiple criteria that a person can meet. Most plans have an age requirement and/or years of service (YOS) before retirement. The income percentage also mostly follows a similar format across the board. Usually, it is a percent set by the organization multiplied by YOS and Highest Earned Income (HEI).
Following the retirement calculation, there’s usually information about early retirement (if the state has such) as well as the penalty associated with early retirement.
The next line deals with HEI – Highest Earned Income and goes into depth about what each state sets as their definition of HEI. Usually, it is some sort of average over a period of time, and may be consecutive years.
Finally, the last section in the notes is the vested time, or more commonly, how long it takes to secure the retirement package. This is the minimum number of years you must participate in the program to reap any benefits.


